S&P500 Daily Action Areas & Price Targets 19/11/26

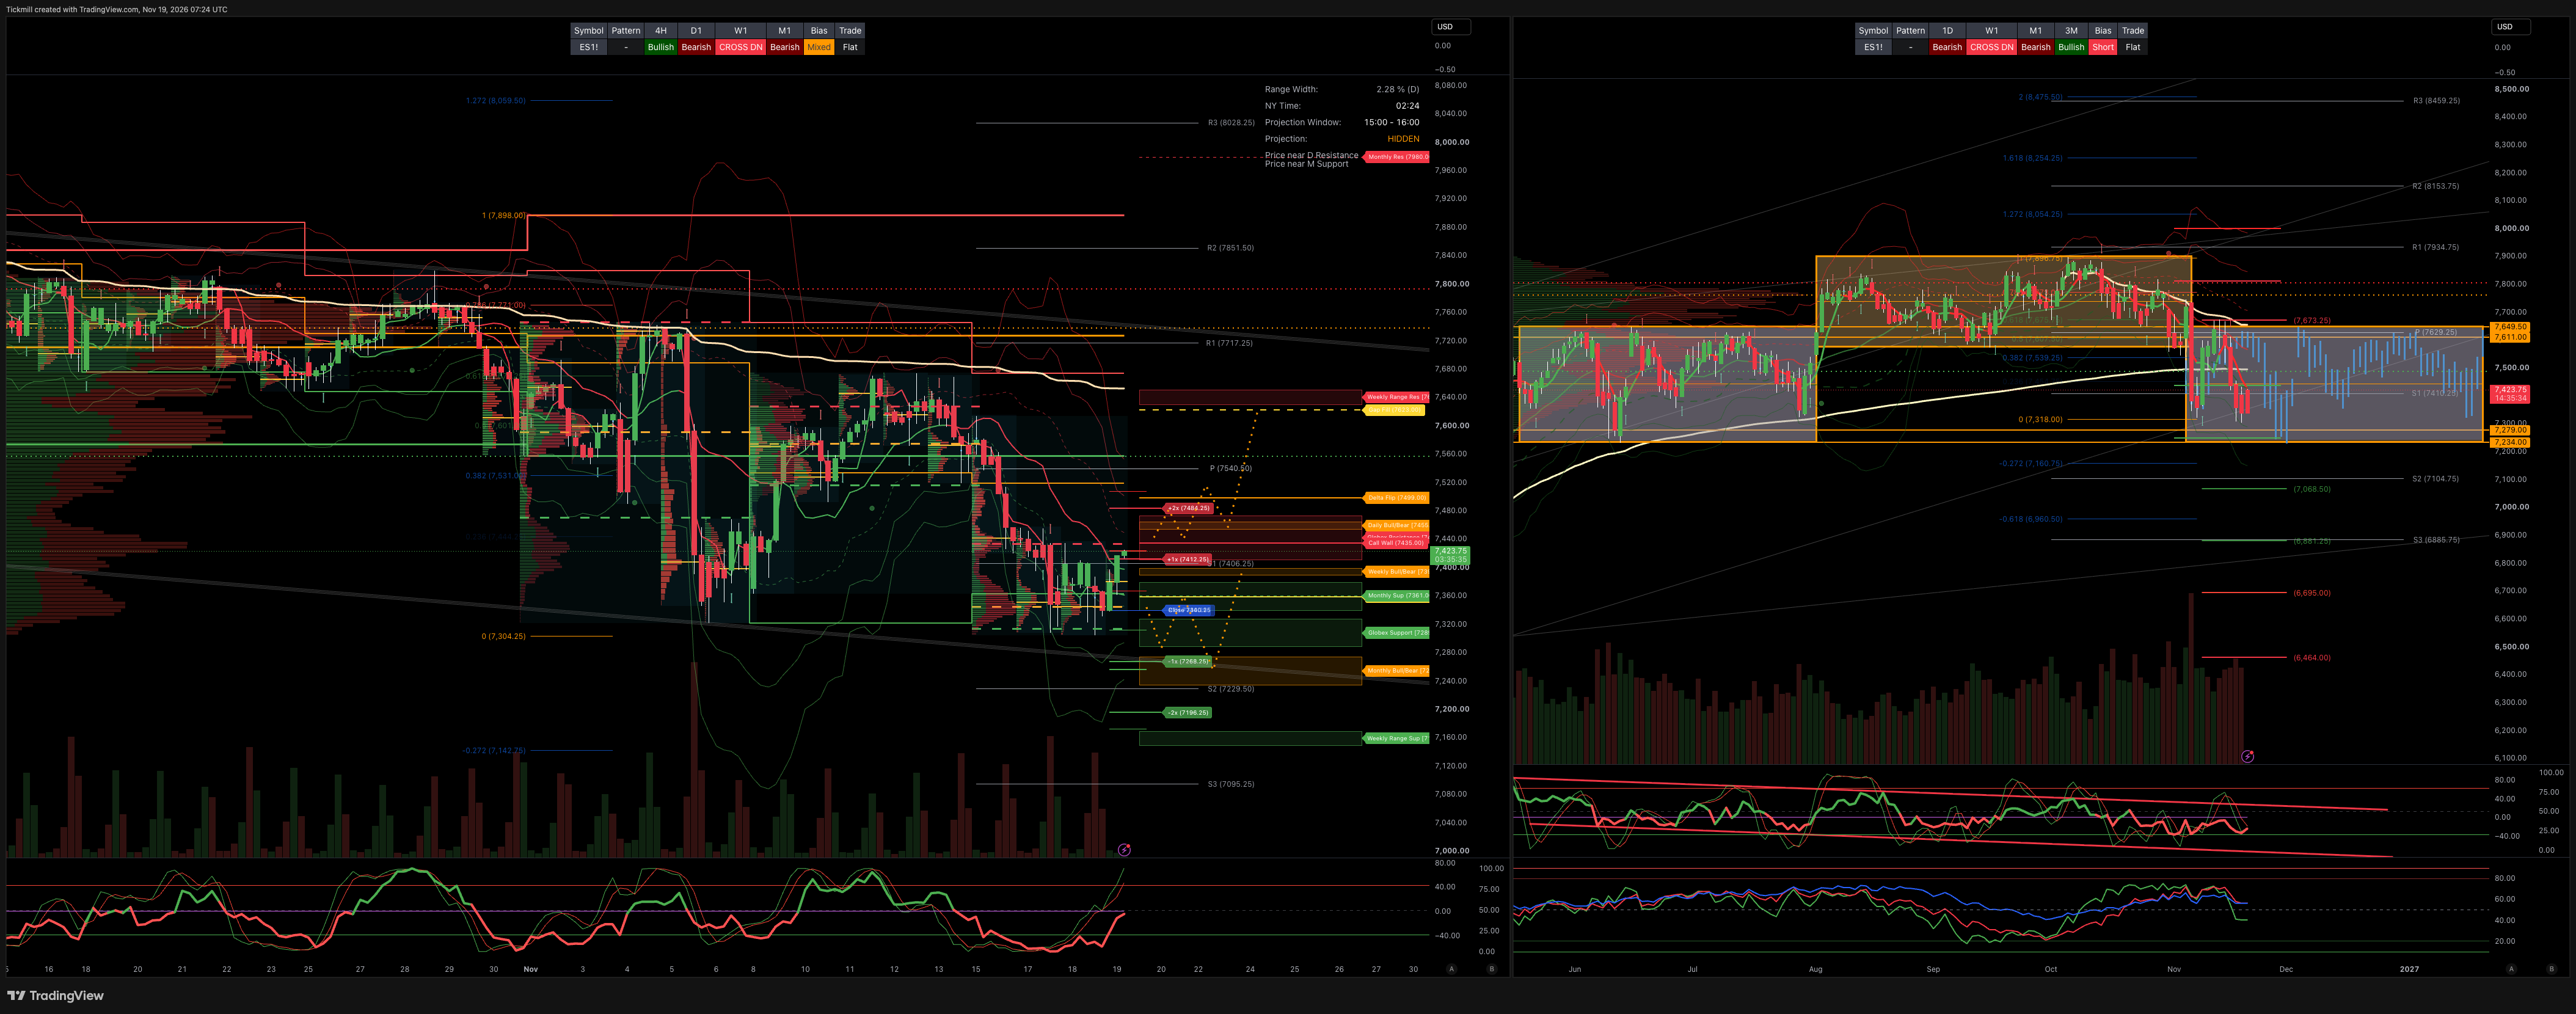
S&P500 Daily Action Areas & Price Targets 19/11/26
***QUOTING ES1!(Z CONTRACT LEVLES) FOR CASH US500 EQUIVALENT LEVELS, SUBTRACT POINT DIFFERENCE***
MONTHLY-WEEKLY& DAILY LEVELS
MONTHLY BULL BEAR ZONE 7275/35
MONTHLY RANGE RES 7980 SUP 7361
WEEKLY BULL BEAR ZONE 7400/7390
WEEKLY RANGE RES 7631/51 SUP 7170/50
DAILY BULL BEAR ZONE 7455/65
GLOBEX RANGE SUP 7728/89 RES 7412/74
GAMMA FLIP 7359
DELTA FLIP 7499
CALL WALLS 7435
PUT WALLS 7340/80
DAILY STRUCTURE - OTFL - 7388
WEEKLY STRUCTURE - OTFL - 7674
MONTHLY STRUCTURE - TBC
VIX BULL BEAR ZONE 22.75
VVIX-to-VIX ratio, currently hovering at approximately 4.82, falls within the historically typical range of 4.0 to 6.0. This suggests that volatility expectations are in a neutral zone, reflecting neither panic nor extreme contrarian sentiments.
PRIMARY TRADES & TARGETS
LONG ON ACCEPTANCE ABOVE DBBZ TARGET DELTA FLIP/WEEKLY RANGE RES
***ADDITIONAL SETUPS & TARGETS HIGHLIGHTED ON THE CHARTS***
(I FADE TESTS OF 2 SIGMA LEVELS ESPECIALLY INTO THE FINAL HOUR OF THE NY CASH SESSION AS 90% OF THE TIME WHEN TESTED THE MARKET WILL CLOSE ABOVE OR BELOW THESE LEVELS)
SPX PUT/CALL RATIO 1.19 (The numbers reflect options traded during the current session.) A put-call ratio below 0.7 is generally considered bullish, and a put-call ratio above 1.0 is generally considered bearish.
JHEQX Upside cap (~7,920–7,950): Dealer gamma hedging at this call strike creates resistance, with market makers likely selling futures into strength and limiting volatility. Downside cushion (~7,270): If SPX drops 5% into Q4, long put gamma may force dealers to buy futures as the index falls, helping stabilize prices. Expiration: December 31, 2026. Strong pinning effects are likely near key strikes into year-end expiration.
DEC2025 OPEX to DEC2026 OPEX is 945 points giving us a range of [5889,7779]
Notes On Structure Implications
Balance: This refers to a market condition where prices move within a defined range, reflecting uncertainty as participants await further market-generated information. Our approach to balance includes favouring fade trades at the range extremes (highs/lows) while preparing for potential breakout scenarios if the balance shifts.
One-Time Framing Higher (OTFH): This represents a market trend where each successive bar forms a higher low, signalling a strong and consistent upward movement.
One-Time Framing Lower (OTFL): This describes a market trend where each successive bar forms a lower high, indicating a pronounced and steady downward movement.
GOLDMAN SACHS FICC & EQUITY TRADING DESK VIEWS
US EQUITIES & DERIVATIVES BRIEFING: POST-NVDA FADE, RETAIL SQUEEZE, DOVISH FED MINUTES NUANCE & 4-YEAR LOW FUTURES LIQUIDITY
US equities finished mixed on Wednesday as early morning index strength faded alongside a sharp intraday reversal in Nvidia (`NVDA`), which dropped from +2% pre-market to close down -3% despite delivering a fiscal Q3 beat-and-raise and a $150B buyback expansion. Desk commentary emphasizes that while leadership and regulatory uncertainty persist, institutional Long-Only sponsorship remains absent—with flow in NVDA characterized by Hedge Fund covering and dip-buying pitted directly against persistent Long-Only supply.
Beneath the surface, two critical structural dynamics defined the session:
1. Severe Futures Liquidity Deterioration: Top-of-book market depth in E-mini S&P 500 futures (`ES1`) averaged just $4.2 million on the touch—marking one of the worst liquidity sessions in the past four years and mechanically amplifying intraday price swings.
2. Retail & Hyperscaler Proxy Rotation: Capital rotated out of pure-play semiconductors into balance-sheet-rich Hyperscalers (`AMZN` +3%, GOOG +1%) and heavily shorted Consumer Retailers, which staged a top-5 YTD performance session (`TJX` +9%, TGT +5%, LOW +0.7% despite an earnings miss) as month-to-date short positioning unwound.
---
### CROSS-ASSET BENCHMARK DASHBOARD
* S&P 500 (SPX): Closed at 7,323.00 (-0.23%) | MOC $2.1B to BUY | VIX compressed -3.69% to 24.52 | Straddle through Friday Nov OpEx: 1.55%
* Nasdaq-100 (NDX): Closed at 27,116.00 (+0.42%) | Supported by Hyperscaler proxy inflows (`AMZN`, GOOG) and Cybersecurity (`PANW` +10%)
* Russell 2000 (RUT): Closed at 2,716.00 (+0.54%) | Aided by retail short covering and lower 10Y yields
* Dow Jones (DJI): Closed at 50,198.00 (-1.11%) | Weighed down by industrial and cyclical drag
* **Consolidated Tape Volume:** 18.855B shares traded (vs. 18.557B YTD daily average); ETFs remained elevated at 35% of total tape (vs. 28% YTD average)
* US 10-Year Treasury Yield: Down -4 bps to 5.06% | Eased following nuanced FOMC meeting minutes
* WTI Crude: Down -3.57% to $82.94/bbl | Extending downward slide toward low-$80s
* Gold: Down -3.22% to $3,725.00/oz | Heavy liquidation alongside firming USD
* US Dollar Index (DXY): Up +29 bps to 103.78 | Advancing steadily toward 104
* Bitcoin: Down -2.79% to $62,467.00 | Extending multi-session drawdown
---
### FOMC MINUTES, FLOOR FLOWS & POST-BELL TECH CATALYSTS
* FOMC Minutes Nuance (Slightly More Dovish Than Headlines):
While headline alerts focused on the potential for an oversized December move, the actual text revealed a high conditional hurdle: "A couple of participants noted that an increase of more than 25 basis points could warrant consideration at the next meeting,"* explicitly caveated by "if incoming inflation data were unfavorable." Treasury yields softened on the release, pulling the 10-Year down 4 bps to 5.06%.
* Institutional Floor Activity (4/10 Activity):
* Asset Manager order flow was muted, while Hedge Funds screened as small net buyers driven primarily by macro index/ETF wrappers. No single sector currently skews materially net for sale across the desk.
* Post-Bell Cybersecurity Surge — Palo Alto Networks (`PANW`):
Shares surged *+8% after hours** (building on a +10% cash session rally) after reporting accelerating fiscal Q1 year-over-year top-line growth across Total Revenue and Next-Generation Security (NGS) ARR, raising full-year Revenue and NGS guidance while maintaining full-year RPO, operating margin, and FCF margin targets.
---
### DERIVATIVES SURFACE: "SPOT DOWN, VOL DOWN" REGIME SHIFT
* Concerning Compression Without Equity Bid:
The S&P 500 traded in a *"spot down, vol down"** regime on Wednesday. Having cleared both monthly VIX expiration and Nvidia earnings, implied volatility compressed across the curve without equities catching a meaningful upward bid—a structural warning sign that macro hedging demand faded without converting into spot accumulation.
* Single-Stock Convexity & Nov OpEx Pricing:
While index option volume stayed subdued, institutional clients stepped into single-stock tech weakness, purchasing *52,500 contracts of Nvidia (`NVDA`) February Call Spreads**.
Looking ahead through Friday’s standard November monthly options expiration (OpEx), the S&P 500 implied straddle is priced at *+/- 1.55%**.
Disclaimer: The material provided is for information purposes only and should not be considered as investment advice. The views, information, or opinions expressed in the text belong solely to the author, and not to the author’s employer, organization, committee or other group or individual or company.
Past performance is not indicative of future results.
High Risk Warning: CFDs are complex instruments and come with a high risk of losing money rapidly due to leverage. 68% and 74% of retail investor accounts lose money when trading CFDs with Tickmill UK Ltd and Tickmill Europe Ltd respectively. You should consider whether you understand how CFDs work and whether you can afford to take the high risk of losing your money.
Futures and Options: Trading futures and options on margin carries a high degree of risk and may result in losses exceeding your initial investment. These products are not suitable for all investors. Ensure you fully understand the risks and take appropriate care to manage your risk.
Patrick has been involved in the financial markets for well over a decade as a self-educated professional trader and money manager. Flitting between the roles of market commentator, analyst and mentor, Patrick has improved the technical skills and psychological stance of literally hundreds of traders – coaching them to become savvy market operators!