S&P500 Daily Action Areas & Price Targets 15/7/26

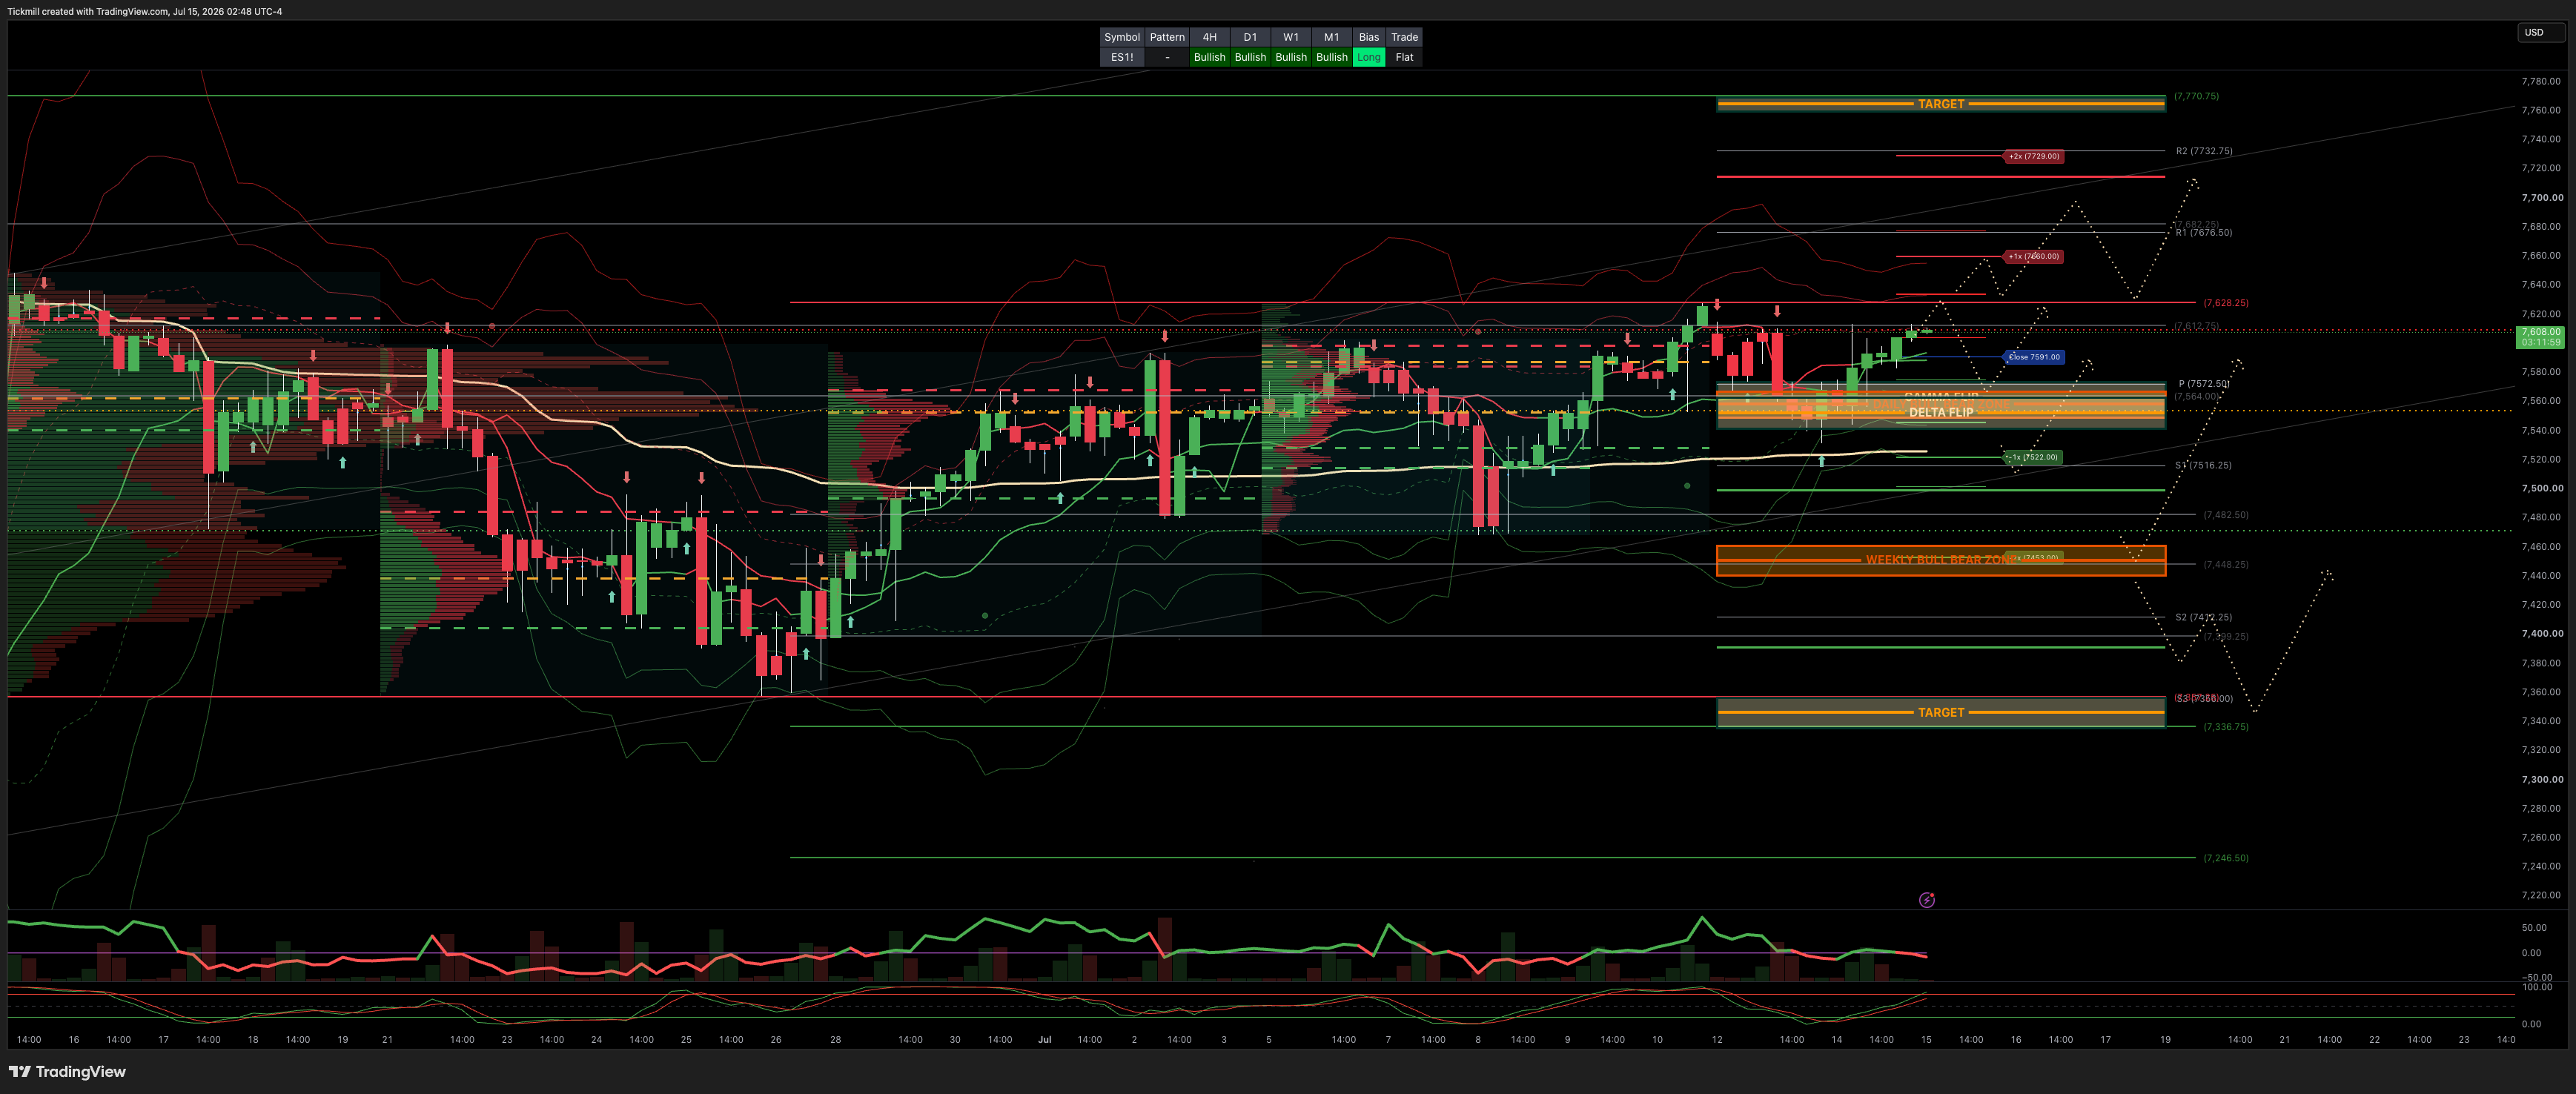
S&P500 Daily Action Areas & Price Targets 15/7/26
***QUOTING ES1! FOR CASH US500 EQUIVALENT LEVELS, SUBTRACT POINT DIFFERENCE***
WEEKLY BULL BEAR ZONE 7460/40
WEEKLY RANGE RES 7710 SUP 7530
MONTHLY RANGE RES 7932 SUP 7384
JHEQX Q3 Collar Short Call Cap: ~7,750 – 7,900 - Long Put Strike: ~7,050 – 7,100 (approx. 5% downside protection) Short Put Strike: ~5,950
DEC2025 OPEX to DEC2026 OPEX is 945 points giving us a range of [5889,7779]
SPX PUT/CALL RATIO 1.18 (The numbers reflect options traded during the current session.) A put-call ratio below 0.7 is generally considered bullish, and a put-call ratio above 1.0 is generally considered bearish.
GS Flow Desk: large S&P 31Aug 7000/7950 strangle in roughly $20mm vega / $115mm premium …My Read – classic “big convexity versus carry” trade: either someone paid a lot to own a wide August move, or someone got paid a lot to bet that the S&P stays comfortably inside the 7000–7950 corridor
DAILY VWAP BULLISH 7589
WEEKLY VWAP BULLISH 7527
MONTHLY VWAP BULLISH 7036
DAILY STRUCTURE - BALANCE 7627/7469
WEEKLY STRUCTURE - BALANCE 7648/7247
MONTHLY STRUCTURE - OTFH - 7199
Balance: This refers to a market condition where prices move within a defined range, reflecting uncertainty as participants await further market-generated information. Our approach to balance includes favouring fade trades at the range extremes (highs/lows) while preparing for potential breakout scenarios if the balance shifts.
One-Time Framing Higher (OTFH): This represents a market trend where each successive bar forms a higher low, signalling a strong and consistent upward movement.
One-Time Framing Lower (OTFL): This describes a market trend where each successive bar forms a lower high, indicating a pronounced and steady downward movement.
DAILY BULL BEAR ZONE 7540/50**ACTIVE FROM RECLAIM**
GAMMA FLIP 7563
DELTA FLIP 7552
DAILY RANGE RES 7660 SUP 7522
2 SIGMA RES 7729 SUP 7454
VIX BULL BEAR ZONE 17.4
TRADES & TARGETS
LONG ON REJECT/RECLAIM DAILY BULL/BEAR ZONE TARGET DAILY RANGE RES***ACTIVE***
***ADDITIONAL SETUPS & TARGETS HIGHLIGHTED ON THE CHARTS***
(I FADE TESTS OF 2 SIGMA LEVELS ESPECIALLY INTO THE FINAL HOUR OF THE NY CASH SESSION AS 90% OF THE TIME WHEN TESTED THE MARKET WILL CLOSE ABOVE OR BELOW THESE LEVELS)
GOLDMAN SACHS FICC & EQUITIES TRADING DESK VIEWS
US Equities Color — Strong Bank EPS + Softer CPI Stabilize the Tape
US equities finished higher after a constructive combination of benign June CPI, strong large-bank earnings, and a momentum bounce helped offset ongoing concerns around oil, software, and healthcare. The S&P 500 gained 38bps to 7,543, the NDX rose 110bps to 29,586, the Russell 2000 added 44bps to 2,966, and the Dow was essentially flat, up 2bps to 52,508. The close saw a modest $570mm MOC to sell.
Volumes remained very light, with 16.301bn shares traded across US equity exchanges versus a YTD daily average of 19.560bn, and overall market volumes roughly 20% below the 20-day moving average. ETF volumes accounted for 29% of the tape, while liquidity remained poor, with top-of-book liquidity around $4.8mm. So while the price action was constructive, it came in the context of thin summer liquidity.
Cross-asset moves were broadly supportive for equities, though oil remains a problem. VIX fell 414bps to 16.46, the US 10-year yield declined to 4.5854%, DXY fell 32bps to 100.91, gold rose 131bps to 4,055, and Bitcoin gained 376bps to $64,484. The main macro outlier was crude, with WTI rising another 221bps to $79.87. That keeps geopolitical and inflation tail risk alive even as the CPI print reduced immediate Fed concerns.
CPI — July Hike Risk Likely Removed
The June CPI report was benign enough to likely take a July Fed hike off the table. GS Economics now estimates June core PCE at 18bps, which is 6bps lower than previously tracked before the CPI release. That is important because the market had been dealing with the unhelpful combination of higher oil, higher yields, and hawkish Fed commentary. A softer inflation print helps re-anchor the disinflation narrative and reduces near-term policy pressure.
The CPI outcome was particularly helpful because it came at a fragile point for the tape. The S&P had been sitting close to the 7,427 CTA short-term pivot, oil was squeezing higher, and NDX was retesting key technical levels. A hotter CPI print could have forced a much more problematic repricing across rates, equities, and systematic flows. Instead, the softer print allowed equities to stabilize and pushed yields modestly lower.
That said, the oil move remains the caveat. WTI near $80 is not consistent with a clean disinflation victory lap if it persists. The market can look through an oil spike if it is viewed as temporary and geopolitical. But if crude continues grinding higher, it will eventually re-enter the inflation, consumer, and margin debate.
Momentum and Tech — Bounce, but Not a Full Clear
Momentum bounced around 4% after a two-day pullback of roughly 8%, helped by stabilization in semis and a stronger NDX tape. That is constructive because the recent AI/momentum unwind had become the key under-the-hood risk. The move suggests the washout has created enough room for tactical dip-buying, especially in areas where valuations and positioning have reset meaningfully.
However, the tech tape was not clean. Semis stabilized, but software wobbled after IBM fell 17% following a negative pre-announcement that cited a Software and Infrastructure performance shortfall. That matters because one of the preferred broadening trades had been a rotation from crowded AI hardware/memory into software and hyperscalers. IBM’s warning does not invalidate that rotation, but it does highlight that earnings risk is real and that investors will be more discriminating.
The desk also saw long and short supply in software, even as overall flows were better to buy. That reinforces the point: investors are not simply re-risking across all of tech. They are rotating, covering shorts, adding selectively, and punishing names where the earnings story does not support the multiple.
Healthcare — HCA Warning Hits the Group
Healthcare was also in focus after HCA fell 7% on a negative pre-announcement. The company lowered full-year 2026 guidance due to a larger-than-expected negative impact from health insurance exchange market membership losses and payer mix deterioration. That pressure also hit Medtech.
This is important because healthcare had recently been a potential defensive / broadening beneficiary as investors reduced AI momentum exposure. HCA’s warning complicates that narrative. The sector can still act as a lower-beta alternative to crowded tech, but the earnings and payer-mix risks are becoming more visible.
Flows — Better to Buy, Led by Tech and Macro Products
The floor was a 5 out of 10 in terms of overall activity and finished +8% better to buy versus a 30-day average of +8bps. Demand was driven by tech and macro products from both long-only investors and hedge funds. That is a more constructive flow backdrop than recent sessions, especially after weeks of AI/momentum de-risking.
Still, the quality of the tape should be interpreted carefully. Volumes were light, liquidity was poor, and a good portion of the recent equity demand has been driven by short covering rather than aggressive long accumulation. The market is stabilizing, but it is not yet showing broad, high-conviction institutional re-risking.
Banks — Strong Results, but Dispersion Matters
The bank earnings kickoff was strong overall. JPM, BAC, C, and WFC all beat 2Q expectations, driven by exceptional strength across capital markets, especially ECM and equities trading, as well as strong investment banking activity. Credit quality remained solid across the group, which is important given recent concerns from credit desks about issuance pressure and widening in hyperscaler credit.
The main divergence was in net interest income. JPM raised full-year NII guidance, while Citi, BAC, and WFC maintained guidance. WFC and Citi also highlighted intensifying competition for deposits, which weighed on the market’s interpretation of their results.
The dispersion across financials was meaningful:
MS traded around +3% on positive read-throughs from equities trading and fee strength.
JPM and BAC rose around 2–2.5%, with conversations pointing to positive estimate revisions across NII and/or operating leverage.
WFC fell around 3% and C dropped around 5% after earnings calls shifted attention to funding costs, deposit competition, and operating leverage.
The three key themes from bank conversations were:
How durable 2Q fee strength is into 2H26 and beyond.
The balance between investment spending and operating leverage.
Funding costs amid robust loan demand and intensifying deposit competition.
The broader takeaway is that banks confirmed a healthier capital markets backdrop, but the market is already differentiating between institutions that can convert activity strength into positive revisions and those facing more pressure from funding costs or expense/investment tradeoffs.
Derivatives — Vol Comes In, but Skew Still Tells a Cautious Story
Derivatives activity reflected the stronger tape. Fixed-strike vols came in notably across the surface, especially in Russell 2000, where front-end vols fell more than 1 vol. Front-end skew relaxed in RUT but steepened in both SPX and NDX, while longer-dated skew was little changed.
That combination is notable. Spot rallied and vol compressed, but SPX and NDX skew steepening suggests investors are still willing to pay for downside protection into earnings and macro catalysts. This is not panic hedging, but it does indicate that investors remain aware of the fragile under-the-hood setup.
RSP vol was offered even as spot was in the red, highlighting some reversion from the recent broadening trade. That fits the day’s leadership profile: NDX led, momentum bounced, and equal-weight lagged.
In single-name and thematic options, activity remained focused on momentum baskets, particularly the high-beta long leg. Financials options were active given earnings, with flows tilted more toward ETFs than single names. There was also customer demand for SK Hynix upside as vol on the newly listed ETF began trading.
Implied Range Projection
The implied move through the end of the week is 0.87%. With the S&P closing at 7,543, that implies a move of roughly:
End-of-week implied SPX range: 7,477 to 7,609.
This is important because the lower end of the implied range, 7,477, remains above the key short-term CTA pivot at 7,427. That means the options market is not pricing a move that would mechanically threaten near-term CTA support under normal conditions. A break below 7,477 would suggest the market is starting to move beyond the priced catalyst range, while a break below 7,427 would be more concerning from a systematic-flow perspective.
On the upside, 7,609 would put the S&P into fresh record-high territory. To get there, the market likely needs continued stability in yields, no further oil shock, semis to hold their bounce, and earnings revisions to remain constructive.
Disclaimer: The material provided is for information purposes only and should not be considered as investment advice. The views, information, or opinions expressed in the text belong solely to the author, and not to the author’s employer, organization, committee or other group or individual or company.
Past performance is not indicative of future results.
High Risk Warning: CFDs are complex instruments and come with a high risk of losing money rapidly due to leverage. 69% and 73% of retail investor accounts lose money when trading CFDs with Tickmill UK Ltd and Tickmill Europe Ltd respectively. You should consider whether you understand how CFDs work and whether you can afford to take the high risk of losing your money.
Futures and Options: Trading futures and options on margin carries a high degree of risk and may result in losses exceeding your initial investment. These products are not suitable for all investors. Ensure you fully understand the risks and take appropriate care to manage your risk.
Patrick has been involved in the financial markets for well over a decade as a self-educated professional trader and money manager. Flitting between the roles of market commentator, analyst and mentor, Patrick has improved the technical skills and psychological stance of literally hundreds of traders – coaching them to become savvy market operators!