S&P500 Daily Action Areas & Price Targets 14/7/26

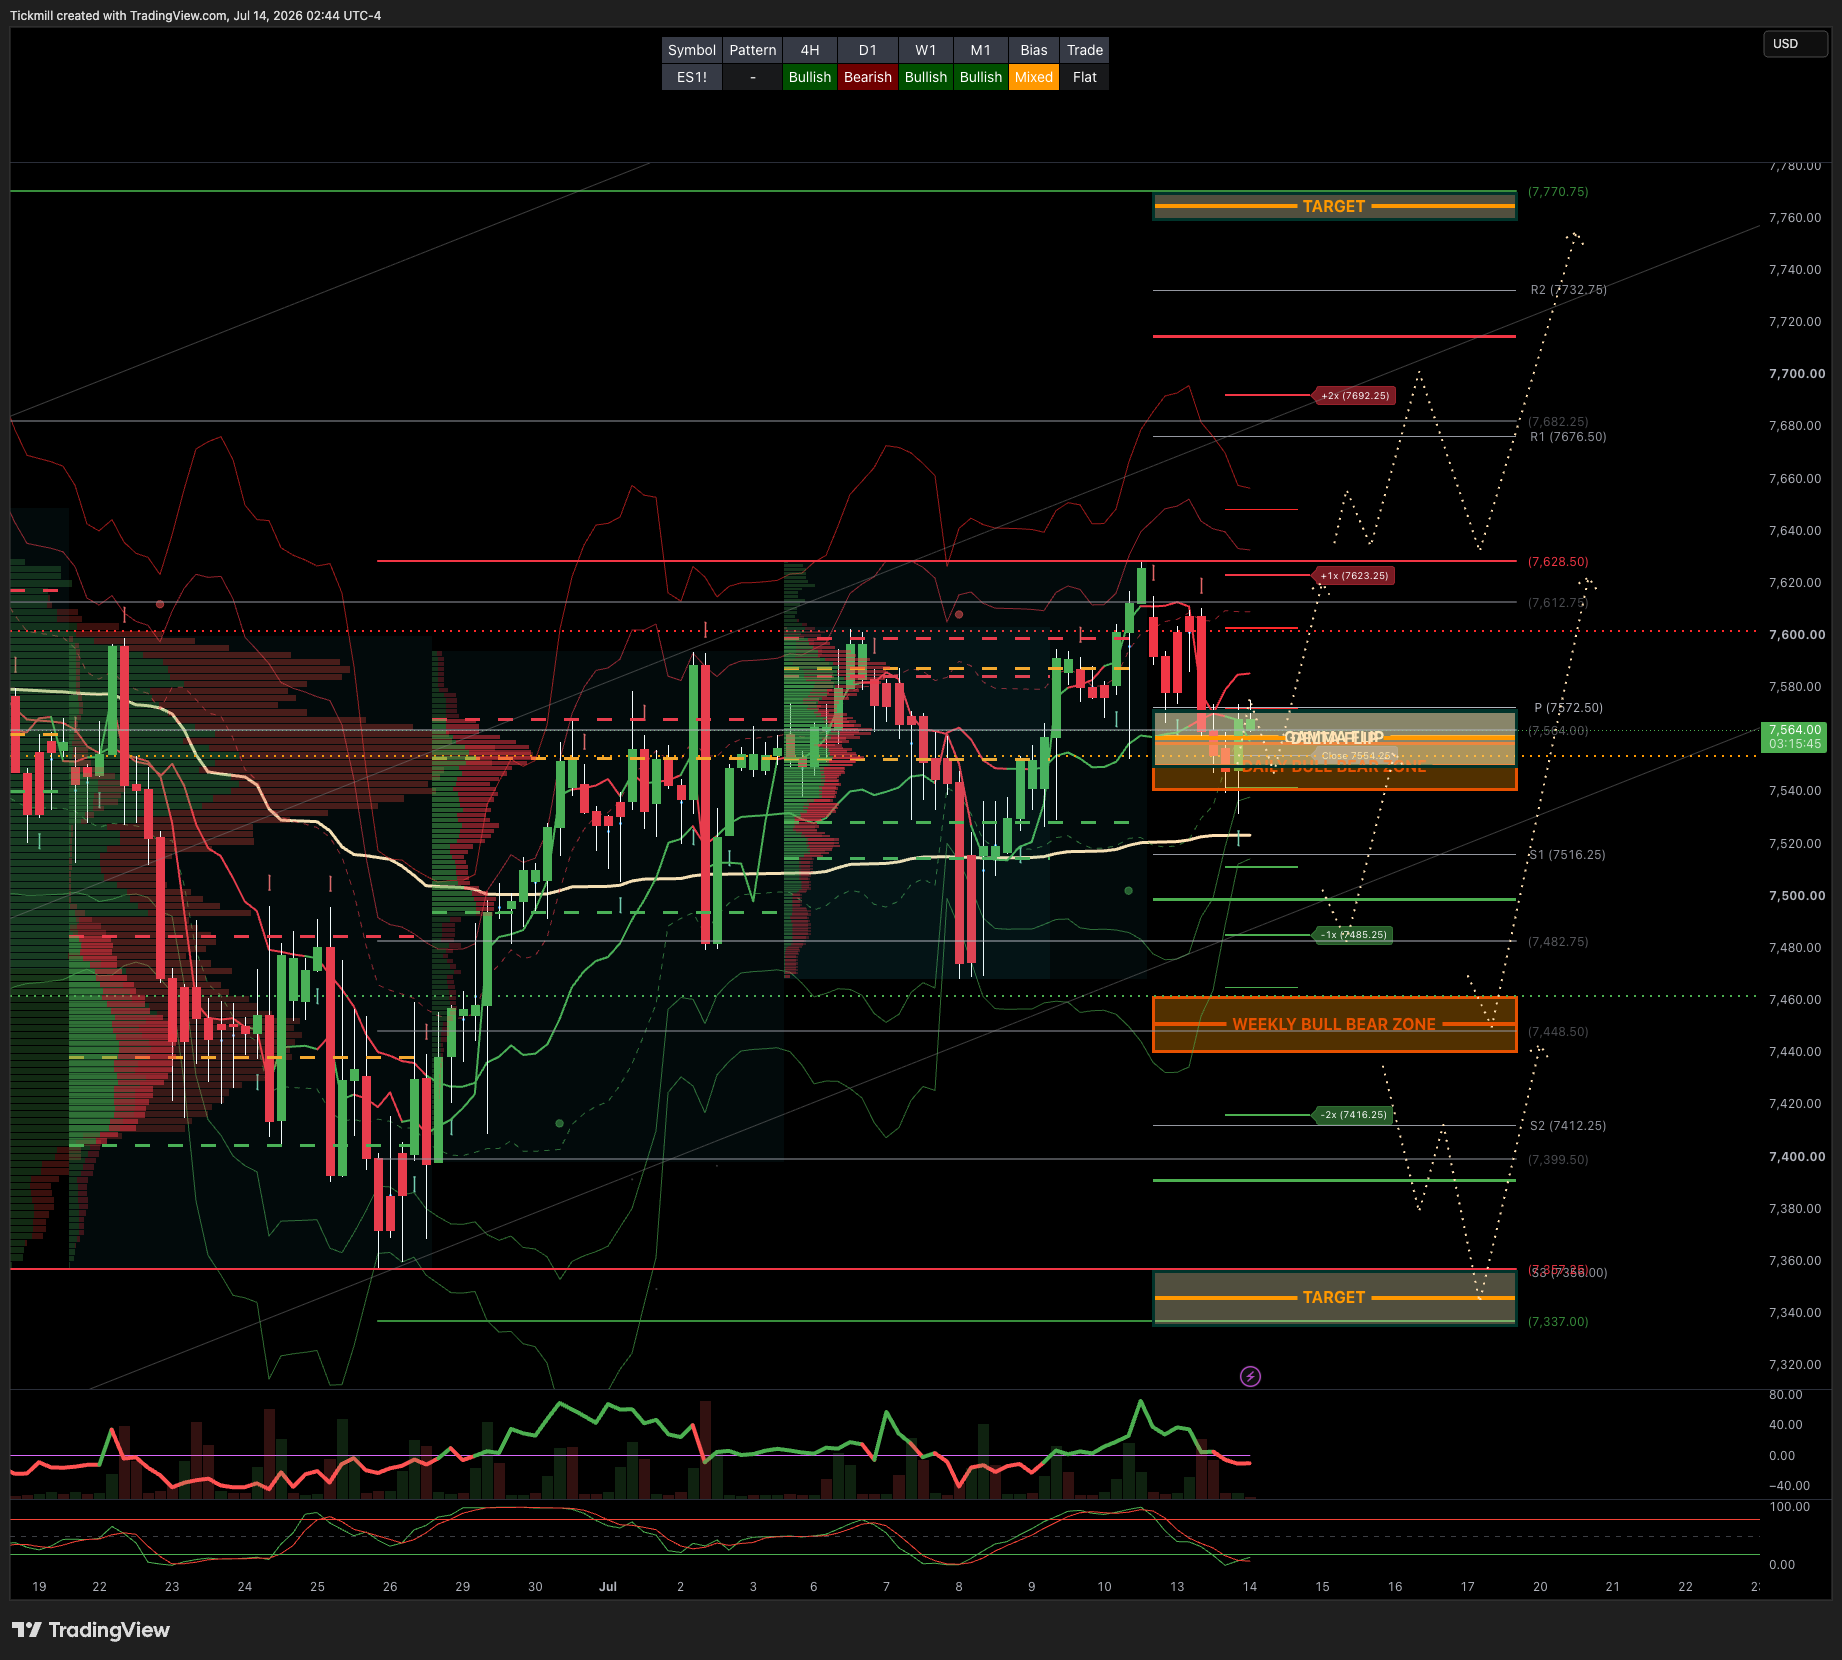
S&P500 Daily Action Areas & Price Targets 14/7/26
***QUOTING ES1! FOR CASH US500 EQUIVALENT LEVELS, SUBTRACT POINT DIFFERENCE***
WEEKLY BULL BEAR ZONE 7460/40
WEEKLY RANGE RES 7710 SUP 7530
MONTHLY RANGE RES 7932 SUP 7384
JHEQX Q3 Collar Short Call Cap: ~7,750 – 7,900 - Long Put Strike: ~7,050 – 7,100 (approx. 5% downside protection) Short Put Strike: ~5,950
DEC2025 OPEX to DEC2026 OPEX is 945 points giving us a range of [5889,7779]
SPX PUT/CALL RATIO 1.23 (The numbers reflect options traded during the current session.) A put-call ratio below 0.7 is generally considered bullish, and a put-call ratio above 1.0 is generally considered bearish.
GS Flow Desk: large S&P 31Aug 7000/7950 strangle in roughly $20mm vega / $115mm premium …My Read – classic “big convexity versus carry” trade: either someone paid a lot to own a wide August move, or someone got paid a lot to bet that the S&P stays comfortably inside the 7000–7950 corridor
DAILY VWAP BEARISH 7570
WEEKLY VWAP BULLISH 7527
MONTHLY VWAP BULLISH 7036
DAILY STRUCTURE - BALANCE 7627/7469
WEEKLY STRUCTURE - BALANCE 7648/7247
MONTHLY STRUCTURE - OTFH - 7199
Balance: This refers to a market condition where prices move within a defined range, reflecting uncertainty as participants await further market-generated information. Our approach to balance includes favouring fade trades at the range extremes (highs/lows) while preparing for potential breakout scenarios if the balance shifts.
One-Time Framing Higher (OTFH): This represents a market trend where each successive bar forms a higher low, signalling a strong and consistent upward movement.
One-Time Framing Lower (OTFL): This describes a market trend where each successive bar forms a lower high, indicating a pronounced and steady downward movement.
DAILY BULL BEAR ZONE 7540/50**ACTIVE FROM OVERNIGHT RECLAIM**
GAMMA FLIP 7560
DELTA FLIP 7560
DAILY RANGE RES 7655 SUP 7517
2 SIGMA RES 7724 SUP 7448
VIX BULL BEAR ZONE 17.4
TRADES & TARGETS
LONG ON REJECT/RECLAIM DAILY BULL BEAR ZONE TARGET CLOSE > DAILY RANGE RES***ACTIVE***
***ADDITIONAL SETUPS & TARGETS HIGHLIGHTED ON THE CHARTS***
(I FADE TESTS OF 2 SIGMA LEVELS ESPECIALLY INTO THE FINAL HOUR OF THE NY CASH SESSION AS 90% OF THE TIME WHEN TESTED THE MARKET WILL CLOSE ABOVE OR BELOW THESE LEVELS)
GOLDMAN SACHS FICC & EQUITIES TRADING DESK VIEWS
US equities traded heavy to start the week, pressured by a combination of geopolitical oil risk, renewed AI/semi weakness, and higher yields. The S&P 500 fell 79bps to 7,515, the NDX dropped 188bps to 29,264, the Russell 2000 lost 89bps to 2,951, and the Dow slipped 26bps to 52,498. Volumes were very light at 15.911bn shares versus a YTD daily average of 19.583bn, with NDX volumes down around 20% and SPX volumes down around 15% versus 20-day averages. The close saw a sizeable $4.8bn MOC to buy, but the broader tape still felt unwindy under the surface.
Cross-asset price action was the bigger story. VIX jumped 1,384bps to 17.11, WTI surged 886bps to $77.74, the US 10-year yield rose to 4.6136%, gold fell 278bps to 4,005, DXY gained 33bps to 101.28, and Bitcoin dropped 307bps to $62,192. The macro mix was clearly less equity-friendly: oil higher, yields higher, dollar higher, gold lower, crypto lower, and vol bid.
The main pressure came from renewed geopolitical concern around the potential re-closure of the Strait of Hormuz. Oil’s nearly 9% move is important not just because of the headline shock, but because the market had already been poorly positioned for upside crude risk after record short positioning in Brent in late June. If Hormuz risk continues to build, crude could trade violently higher through positioning rather than purely through confirmed physical supply disruptions. That would be a direct challenge to the soft-landing / disinflation narrative and would hit the consumer, transport, margins, and rate-cut hopes simultaneously.
The second pressure point was another weak overnight session in Asia, with South Korea and Japan memory names lower. The move felt positioning-driven, but it still added pressure to US semis and the broader AI complex. This continues the theme from recent sessions: the fundamental AI capex story has not necessarily broken, but the crowded, high-beta, first-half winners remain vulnerable to de-risking. The NDX is now re-testing its 50-day moving average, which makes near-term tech price action especially important. A clean hold would help stabilize risk appetite; a decisive break would likely force more systematic and momentum-related supply.
Momentum again traded poorly, with the high-beta momentum pair down around 6%. That said, the move occurred on lighter volumes and in a quieter tape than the index-level weakness might imply. The floor was only a 3 out of 10 in terms of activity and finished roughly flat versus a 30-day average of 44bps to buy. Single-stock activity was muted ahead of tomorrow’s major catalyst stack: CPI plus bank earnings from BAC, C, GS, JPM, and WFC. So while the price action was ugly, it did not have the feel of broad panic or forced liquidation.
The third macro headwind was higher yields after Fed Governor Waller’s hawkish commentary that the FOMC must be ready to tighten policy to avoid a repeat of the 2021–2022 inflation episode. That matters because the market had recently leaned into a more benign Fed path after softer labor data. A renewed inflation/oil/yield impulse complicates that setup. If CPI comes in soft, it can help repair the rate narrative; if CPI surprises hot, especially alongside higher oil, the market could quickly reprice toward a less friendly Fed reaction function.
For CPI, the expectation is for a 0.17% increase in June core CPI, below +0.3% consensus, corresponding to a year-over-year rate of +2.76% versus +2.9% consensus. Headline CPI is expected to decline 0.11%, roughly in line with the -0.1% consensus, helped by lower energy prices. The forecast is consistent with a 0.24% increase in core PCE in June, with another large increase in financial services expected to provide some upward pressure there.
The component details matter. The expected soft core CPI print is built on four key assumptions:
Weak autos inflation, with used car prices down 0.5%, new car prices down 0.1%, and car insurance down 0.1%.
Benign shelter readings, with OER up 0.23% and rent up 0.17%, reflecting the continued slowdown in the underlying shelter trend.
More moderate travel-services inflation, with airfares up 1.5% and hotels up 0.3%, consistent with alternative price data.
Downward pressure from residual seasonality, including in communication and new cars.
If the report lands close to that forecast, it should help offset the market’s renewed concern about oil and yields, at least tactically. A soft core CPI would support the view that the disinflation process remains intact even as geopolitical energy risk has re-emerged. But the market’s response may still depend on whether oil continues to rise. A benign CPI print is helpful; a benign CPI print plus crude stabilizing would be much more powerful.
Bank earnings also matter because financials have been sold into the reporting week. With BAC, C, GS, JPM, and WFC all reporting, the market will get an immediate read on credit quality, capital markets activity, deposit costs, loan growth, trading, NII trajectories, and management tone. Given the recent concern from credit desks about “too much too fast” issuance and the widening in hyperscaler credit, bank commentary on risk appetite and credit conditions could be more important than usual.
Derivatives activity was concentrated in short-dated hedging, with more buyers of vol than monetization. Despite the selloff, there was still little evidence of panic. Fixed-strike S&P vols were bid, but NDX vols specifically underperformed. That is notable because the recent realized weakness has been heavily concentrated in tech and AI, yet the vol market is not chasing NDX vol higher in a disorderly way. This again points to a market that is hedging catalysts rather than panicking.
The more important vol signal remains historic lows in S&P implied correlation. With implied correlation this depressed, index hedges look attractive ahead of a catalyst-rich stretch. The logic is straightforward: if macro, earnings, oil, or credit stress causes single-name moves to become more synchronized, index vol can reprice quickly. The setup favors re-engaging in index hedges because the market is still pricing a lot of differentiation and not much broad index stress.
The NDX/SPX implied vol spread remains historically elevated at around 10 vols, but it has realized around 16 vols over the past month, which sits near multi-decade highs. That means QQQ has continued to move materially more than SPY, and the spread is still not obviously rich versus realized. Given that backdrop, month-end QQQ puts remain a preferred hedge for continuation of the recent tech/AI underperformance, especially with CPI, bank earnings, and broader Q2 earnings season now beginning.
Implied Range Projection
Tomorrow’s SPX straddle went out at 0.70%. With the S&P closing at 7,515, that implies a one-session move of roughly:
Tomorrow’s implied SPX range: 7,462 to 7,568.
The end-of-week straddle is priced at 1.20%, implying a move of roughly:
End-of-week implied SPX range: 7,425 to 7,605.
Those levels are useful because the market is heading into a dense catalyst window while still pricing a relatively contained index move. A break below 7,462 tomorrow would suggest the combination of oil, yields, and tech weakness is starting to overwhelm the benign CPI/earnings setup. A move above 7,568 would suggest the market is comfortable looking through geopolitical risk, especially if CPI is soft and banks do not introduce new credit concerns.
For the week, 7,425 is the more important downside line. A break below that level would imply that the market is moving beyond a normal catalyst-priced range and that index hedges are starting to matter. On the upside, 7,605 would put the S&P back into record-high territory and would likely require some combination of soft CPI, crude stabilization, a rebound in semis/NDX, and benign bank earnings commentary.
Disclaimer: The material provided is for information purposes only and should not be considered as investment advice. The views, information, or opinions expressed in the text belong solely to the author, and not to the author’s employer, organization, committee or other group or individual or company.
Past performance is not indicative of future results.
High Risk Warning: CFDs are complex instruments and come with a high risk of losing money rapidly due to leverage. 69% and 73% of retail investor accounts lose money when trading CFDs with Tickmill UK Ltd and Tickmill Europe Ltd respectively. You should consider whether you understand how CFDs work and whether you can afford to take the high risk of losing your money.
Futures and Options: Trading futures and options on margin carries a high degree of risk and may result in losses exceeding your initial investment. These products are not suitable for all investors. Ensure you fully understand the risks and take appropriate care to manage your risk.
Patrick has been involved in the financial markets for well over a decade as a self-educated professional trader and money manager. Flitting between the roles of market commentator, analyst and mentor, Patrick has improved the technical skills and psychological stance of literally hundreds of traders – coaching them to become savvy market operators!